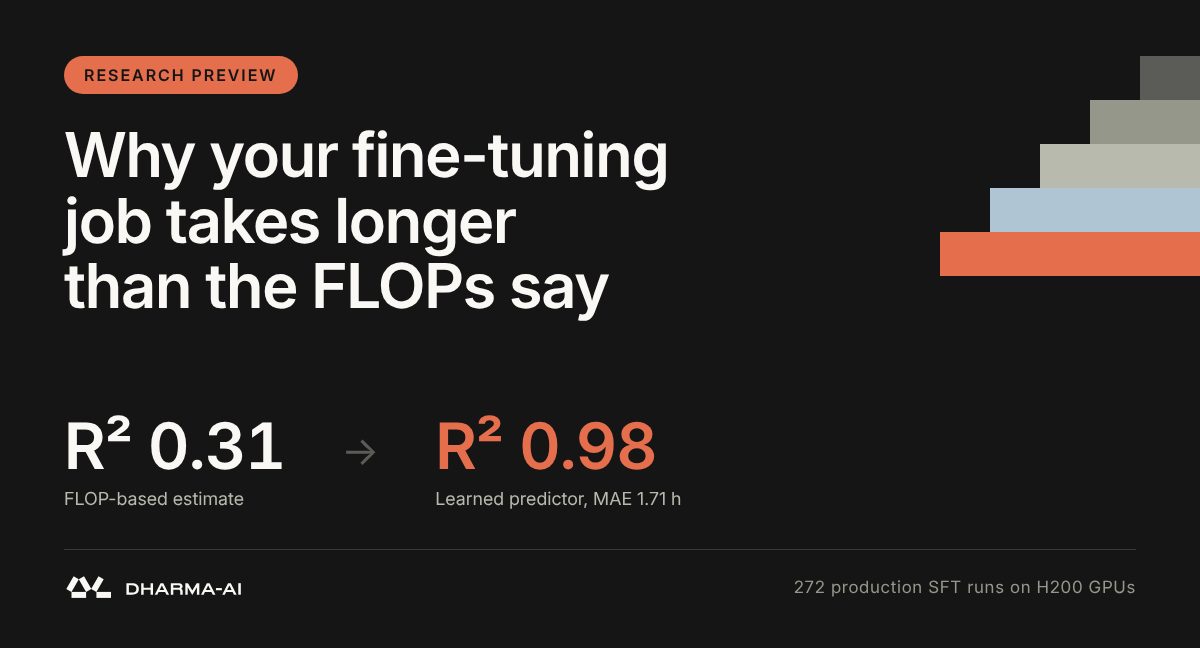
Standard infrastructure planning relies on theoretical compute formulas, but empirical measurements from 272 supervised fine-tuning jobs on NVIDIA H200 GPUs revealed that classic calculations miss actual completion times by double-digit hours. Enterprise engineering teams schedule hardware around floating-point math, assuming that the cost of updating parameters translates directly into physical wall-clock execution. Yet classical calculations through floating-point operations ignore cluster overheads, turning GPU capacity planning into an expensive gamble. When workloads run on shared infrastructure, the gap between arithmetic throughput and calendar time determines whether hardware delivers return on capital or sits stranded between job dispatches.
Why does real fine-tuning duration exceed theoretical estimates by multiples? The discrepancy lies in everything that happens outside the model optimization loop, where tokenization, data loading, artifact retrieval, and environment initialization consume valuable capacity before active training even begins.
The Breakdown of Pure Compute Formulas
Analytical performance models evaluate transformer performance through theoretical limits. For a dense Transformer, optimization loop compute costs roughly 6 multiplied by the parameter count multiplied by the number of training tokens.
"The short version: the usual FLOP-based estimate explains little of what we observed (R² = 0.31, MAE 12.41 h)."
Dividing that arithmetic burden by spec-sheet peak floating-point throughput and Model FLOPs Utilization gives the theoretical runtime. In production environments, Model FLOPs Utilization typically sits between 30% and 60%, with the precise level unknown prior to dispatch.
As the operational log analysis highlighted, floating-point metrics systematically fail to account for operational latency. Before compute starts, clusters run environment initialization, artifact retrieval, weights loading, and dataset tokenization. During active training, jobs execute periodic validation routines and state checkpointing to shared storage, competing with concurrent workloads across adjacent nodes.
Empirical Data Across 7,382 GPU-Hours
To measure this structural delay, researchers evaluated operational logs totaling roughly 7,382 GPU-hours. The sample encompassed 272 supervised fine-tuning runs utilizing several architecture families scaling up to 15 billion parameters, incorporating LoRA adaptations and full-parameter updates across diverse hyperparameter profiles.
Allocations were deployed on 1, 2, or 4 GPUs sourced from a dynamic pool of 8 to 32 H200 processors distributed across 1 to 4 server nodes. One counter-argument holds that static hardware allocations could eliminate cluster variance, making basic arithmetic formulas sufficient for operational schedules. However, static capacity isolation cannot eliminate internal job requirements such as tokenization pipelines, multi-gigabyte state serialization, or intermediate model evaluations. Even under uniform hardware conditions, non-compute tasks introduce substantial, variable run-time extensions.
Machine Learning Corrections for Allocation Strategy
Predictive machine learning models bridge the scheduling delta by analyzing parameters known strictly prior to dispatch, bypassing runtime log monitoring entirely.
A CatBoost regressor incorporating 24 features—capturing checkpoint frequency, parameter serialization scale, and evaluation volume alongside baseline compute—reaches an R² of 0.98.
"Better duration estimates turn this into planning instead of guesswork: what runs, when, and on how many GPUs, with less idle capacity in between."
Tested through 5-fold cross-validation, the regressor recorded a median error of 0.51 hours and a mean absolute error of 1.71 hours. Contrast that with standard FLOP equations yielding an R² of 0.31 and an average error of 12.41 hours across identical enterprise workloads.
Why it matters
Project budgets and cluster provisioning timelines quickly burn through cash when engineering plans hinge purely on nominal chip specifications for NVIDIA H200 accelerators. In late August theoretical FLOP counts failed to reflect real costs, and now hard operational logs spanning 7,382 GPU hours show that routine tokenization, environment initialization, and checkpoint saves systematically swallow dozens of uncounted hours. Companies pay top dollar for raw arithmetic throughput on shared nodes, only to watch expensive hardware idle during messy I/O pipeline handoffs. Datasheet peak throughput works wonders on paper right until high-end accelerators end up waiting hours on storage pipelines.
Our stories: Why FLOPs Fail to Measure AI Latency and Power Costs (August 24).